How Does Simpsons Paradox Affect Decisions Make 2023 09 26
Paste your rich text conte
In the realm of business and data analysis, the accuracy and reliability of Key Performance Indicators (KPIs) play a pivotal role in decision-making processes, mainly the knowledge that we have now in our dataset structures. However, the interpretation of KPIs can sometimes be influenced by a statistical phenomenon known as Simpson’s Paradox.
The first time I saw this name I thought “gosh, this is too complicated, its not possible that this is my problem”, but in real, it’s just a name, and don’t worry, the concept its quite simple, the side effect might be a problem.
Simpson’s Paradox is a counterintuitive phenomenon where trends or associations observed in aggregated data can reverse when the data is broken down into subgroups. I’m here to explore and share the concept of Simpson’s Paradox and its potential impact on our KPIs, which could be in business, a software engineering team, or even some personal data that you’re analyzing, emphasizing the importance of careful data analysis to avoid misleading conclusions.
What is this Simpson’s Paradox?
Simpson’s Paradox, named after British statistician Edward H. Simpson, arises when the direction of an association or trend between two variables reverses when data is divided into different subgroups. This paradox is particularly deceptive because it challenges our intuitive understanding of data relationships. It can occur when there are confounding variables, varying subgroup sizes, or disproportionate weighting of data within subgroups.
For instance, imagine a hypothetical scenario where a company tracks its customer satisfaction rate across two years and observes a decline in overall satisfaction from 80% to 75%. However, when the data is disaggregated by customer segment, it reveals that every segment individually experienced an increase in satisfaction. This seemingly contradictory situation is a classic example of Simpson’s Paradox. I had this experience tracking a Software Engineering team’s productivity, which is by itself a challenge that turned worse when I faced that. I usually manage the percentage of rework of my teams, trying to identify how much their delivery we need to rework on the task/feature. One day I decided to do a test with two of my packs, one month they worked doing a discovery phase of each feature, and another month they didn’t, just starting coding. To my surprise, in the month that they didn’t have a discovery phase, the percentage of rework was 31% while when they did was 33% meaning that they had more rework when working in the discovery phase. The first reaction was “NICE, WE DON’T NEED THE DISCOVERY PHASE ANYMORE”, the second one was “Wait a minute, let’s see their results individually” When I broke down the teams in two, Team A and Team B and realized that we faced the Simpson’s Paradox. Team A had 40% of rework without the discovery phase against 34% with the discovery phase, while Team B had 100% of rework without the discovery phase against 33% with the discovery phase.
Zoom image will be displayed
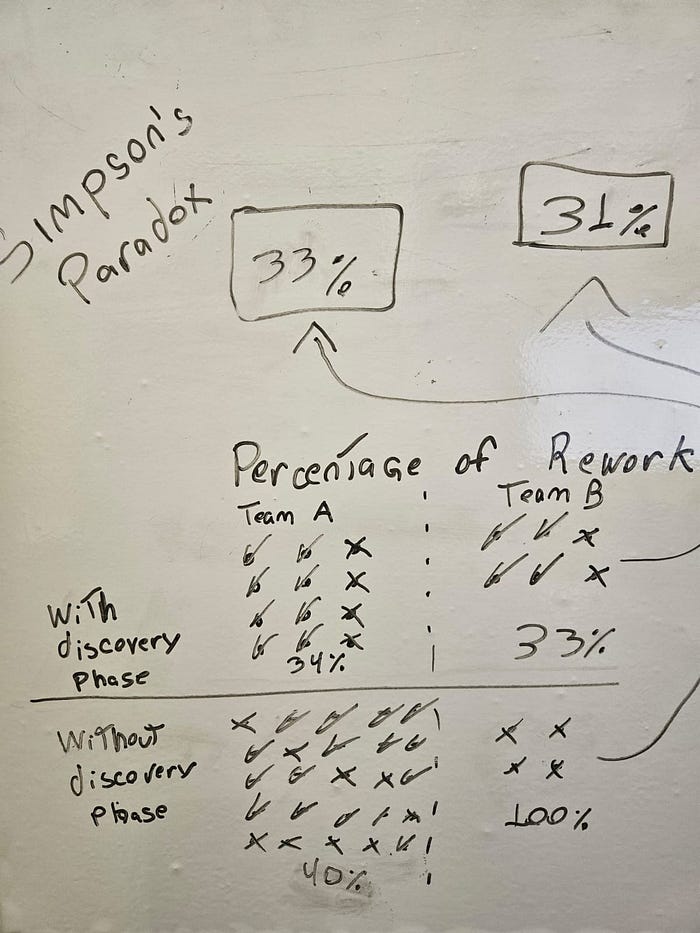
Percentage of rework KPI aggregating two teams
The problem? This aggregation and the differences between the team challenges, aka their context make the metric wrong when looked together.
The Impact on Business KPIs
Simpson’s Paradox can have profound implications for businesses, especially when it pertains to KPIs. Here are several ways in which it can affect business KPIs:
Misleading Strategic Decisions: When business leaders make decisions based on aggregated KPIs without considering potential subgroup variations, they may inadvertently choose a course of action that is detrimental to the company’s overall objectives. This can lead to poor strategic planning and execution. Imagine if I decided to stop having discovery phases.
Inaccurate Performance Assessment: KPIs are often used to evaluate the performance of departments, teams, or individuals. If Simpson’s Paradox is not considered, it can unfairly penalize or reward certain groups, masking their true contributions to the organization’s goals.
Customer and Market Insights: For businesses operating in diverse markets or catering to various customer segments, failing to account for Simpson’s Paradox can lead to misguided market insights. This can result in misallocation of resources, ineffective marketing strategies, and missed growth opportunities.
Regulatory Compliance: In regulated industries, compliance with specific performance metrics is crucial. If Simpson’s Paradox is not addressed, a company may appear to be in compliance at the aggregate level while failing to meet regulatory requirements within subgroups.
Mitigating the Impact of Simpson’s Paradox
To mitigate the impact of Simpson’s Paradox on business KPIs, organizations should adopt a data-driven approach that includes the following steps:
Data Disaggregation: Whenever possible, analyze data at both the aggregated and disaggregated levels. This will help uncover hidden trends and disparities that may not be apparent in the overall KPIs.
Identify Confounding Factors: Investigate potential confounding variables that could be driving the paradoxical results. Understanding the underlying causes is essential for accurate interpretation and decision-making.
Balanced Representation: Ensure that subgroups are adequately represented in the data to avoid disproportionate weighting, which can skew results. Statistical techniques like weighting and stratification can help achieve balance.
Contextual Understanding: Encourage data analysts and decision-makers to consider the context and domain knowledge when interpreting KPIs. Avoid making hasty decisions based solely on statistical outcomes.
Conclusion
Simpson’s Paradox is a subtle but potent statistical phenomenon that can significantly impact business KPIs if not properly understood and addressed. In today’s data-driven world, the importance of accurate KPIs cannot be overstated, as they form the foundation of strategic decision-making. By recognizing the potential for Simpson’s Paradox and implementing sound data analysis practices, businesses can ensure that their KPIs provide a more accurate reflection of their performance and help drive informed decisions that lead to success.
nt here. You can paste directly from Word or other rich text sources.